


Updated: January 2026
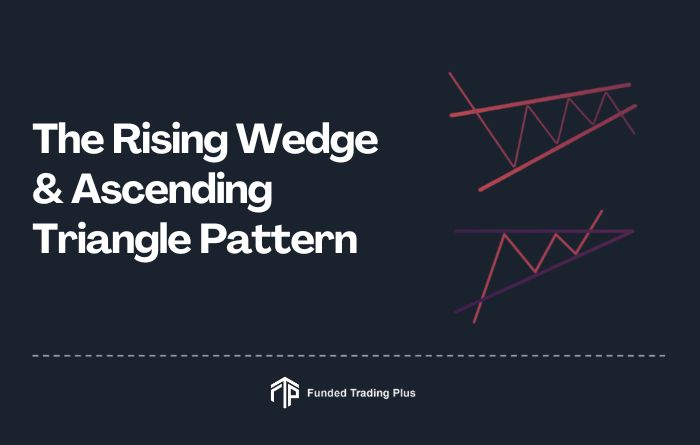
In technical analysis, misidentifying a pattern is one of the fastest ways to fail a prop trading evaluation. Two of the most commonly confused patterns are the Ascending Triangle and the Rising Wedge.
To the untrained eye, they look nearly identical: price is making higher highs or higher lows, and lines are converging. However, their outcomes are usually opposites.
- The Ascending Triangle is typically a Bullish Continuation signal (a breakout waiting to happen).
- The Rising Wedge is typically a Bearish Reversal signal (a trap for buyers).
In a funded account environment, where protecting your drawdown is just as important as making profit, knowing the difference is critical. Before you dive into the technical breakdown below, ensure you understand the fundamentals of risk in a prop firm setting by reading our Beginner Prop Trader Education Guide.
Below, we break down exactly how to spot the difference and trade these patterns effectively.
Understanding chart patterns is crucial for successful forex trading. Two common patterns that often confuse traders are the ascending triangle pattern and the rising wedge. While they may appear similar at first glance, these patterns have distinct characteristics and implications for price movement. In this guide, we’ll explore the ascending triangle pattern, rising wedge, and their key differences.
Ascending Triangle Pattern: A Bullish Continuation Signal
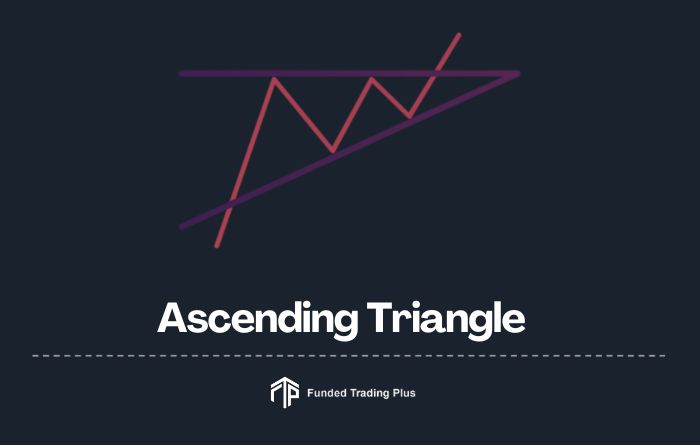
The ascending triangle pattern is a popular chart formation in technical analysis, typically considered a bullish continuation pattern. It’s characterised by a series of price movements that create a distinctive triangular shape on the chart.
Key Characteristics:
- Flat Upper Resistance Line: This horizontal line connects at least two price peaks, forming a clear level of resistance that the price has struggled to break through.
- Upward-Sloping Lower Support Line: The lower boundary of the pattern is formed by connecting the rising lows, indicating increasing buying pressure.
- Increasing Buying Pressure: As the pattern develops, buyers become more aggressive, pushing the price to test the resistance level repeatedly.
- Formation During Uptrends: Ascending triangles typically form during an existing uptrend, signalling a potential continuation of that trend.
- Converging Trendlines: As the pattern progresses, the distance between the upper resistance and lower support lines narrows.
Key Features:
- Horizontal Resistance Line: This flat upper boundary represents a price level where sellers have consistently entered the market.
- Rising Support Line: The upward-sloping lower boundary indicates that buyers are entering the market at progressively higher prices.
- Typically Bullish Outcome: While no pattern is 100% reliable, ascending triangles often lead to upward breakouts.
- Increased Volume on Breakouts: A valid breakout is usually accompanied by a significant increase in trading volume, confirming the strength of the move.
- Time Frame Flexibility: Ascending triangles can form on various time frames, from intraday charts to weekly or monthly charts.
Trading the Ascending Triangle Pattern:
- Entry Strategy:
- Enter long positions on a breakout above the resistance line.
- Confirm the breakout with increased volume and a candle close above the resistance.
- Consider waiting for a retest of the broken resistance (now support) for a potentially safer entry.
- Stop-Loss Placement:
- Set the initial stop-loss below the pattern’s support line.
- As the trade progresses, consider trailing the stop-loss to lock in profits.
- Profit Targets:
- The most common target is calculated by measuring the height of the pattern at its widest point and projecting this distance from the breakout point.
- Consider taking partial profits at this level and letting a portion of the position run with a trailing stop.
- Risk Management:
- Ensure the potential reward is at least 2-3 times the risk before entering the trade.
- Size your position based on your risk tolerance and the distance to your stop-loss.
- Pattern Failure:
- Be aware that the pattern can fail. A breakdown below the ascending support line could signal a failed pattern and a potential reversal.
Additional Considerations for the ascending triangle pattern:
- Confluence: Look for other technical indicators or chart patterns that support the bullish outlook, such as bullish candlestick patterns or favourable moving average alignments.
- Time in Pattern: Ascending triangles that take longer to form (more price swings within the pattern) are generally considered more reliable.
- Market Context: Always consider the broader market context and any fundamental factors that might influence the asset’s price.
By understanding and correctly identifying ascending triangle patterns, traders can potentially capitalize on bullish continuation moves in the forex market. However, as with all technical patterns, it’s crucial to use them in conjunction with other analysis techniques and sound risk management practices.
Rising Wedge: A Potential Reversal Pattern
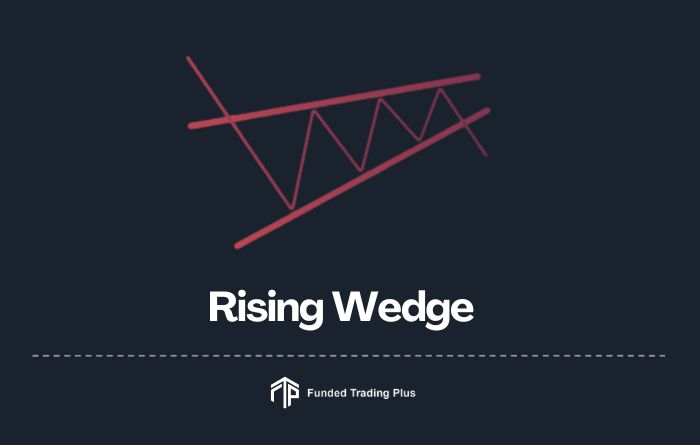
The rising wedge, in contrast to the ascending triangle pattern, is often interpreted as a bearish reversal signal in technical analysis. This pattern can be particularly tricky for novice traders as it may initially appear bullish due to its upward slope.
Key Characteristics:
- Converging Trendlines: The pattern is formed by two trendlines that both slope upwards but are converging. This convergence is crucial to the pattern’s formation.
- Steeper Upper Resistance: The upper resistance line typically has a steeper slope than the lower support line, indicating weakening upward momentum.
- Decreasing Volume: As the pattern progresses, trading volume tends to decrease, suggesting a lack of conviction in the upward price movement.
- Versatile Formation: Rising wedges can form in both uptrends (as a reversal pattern) and downtrends (as a continuation pattern), making context crucial for interpretation.
- Price Action: Within the wedge, price action often shows higher highs and higher lows, but the rate of these increases slows as the pattern develops.
Key Features:
- Upward-Sloping Trendlines: Both the resistance and support lines slope upward, distinguishing it from other patterns.
- Narrowing Price Range: As the trendlines converge, the trading range becomes progressively tighter.
- Bearish Implications: Despite the upward slope, this pattern often signals a potential trend reversal to the downside.
- Decreasing Volume: The reduction in trading volume within the pattern is a key characteristic, often confirming the pattern’s bearish potential.
- Time Frame Flexibility: Rising wedges can form on various time frames, from short-term intraday charts to longer-term weekly or monthly charts.
Trading the Rising Wedge:
- Entry Strategy:
- Enter short positions on a breakdown below the lower support line.
- Confirm the breakdown with increased volume and a candle close below the support line.
- Consider waiting for a retest of the broken support (now resistance) for a potentially safer entry.
- Stop-Loss Placement:
- Set the initial stop-loss above the upper resistance line or above the most recent swing high within the pattern.
- As the trade progresses, consider trailing the stop-loss to protect profits.
- Profit Targets:
- The conventional target is calculated by measuring the height of the pattern at its widest point and projecting this distance downward from the breakdown point.
- Consider taking partial profits at this level and letting a portion of the position run with a trailing stop.
- Risk Management:
- Ensure the potential reward is at least 2-3 times the risk before entering the trade.
- Size your position based on your risk tolerance and the distance to your stop-loss.
- Pattern Failure:
- Be aware that the pattern can fail. A strong breakout above the upper resistance line could signal a failed pattern and a potential continuation of the uptrend.
Further reading: Technical Analysis vs Fundamental Analysis, Which One Is Better?
Additional Considerations For The Rising Wedge:
- Confluence: Look for other technical indicators that support the bearish outlook, such as bearish divergence on oscillators or resistance at key moving averages.
- Pattern Duration: Rising wedges that take longer to form and contain more price swings are generally considered more reliable.
- Market Context: Always consider the broader market trends and any fundamental factors that might influence the asset’s price.
- False Breakouts: Be cautious of false breakouts, which are common with this pattern. Consider using additional confirmation signals before entering a trade.
- Trend Strength: The strength of the preceding trend can influence the reliability of the pattern. A rising wedge forming after a strong, extended uptrend may have a higher probability of leading to a reversal.
By understanding the nuances of the rising wedge pattern, traders can potentially identify bearish reversal opportunities in the forex market. However, as with all technical patterns, it’s crucial to use them in conjunction with other analysis techniques and maintain strict risk management practices.
Ascending Triangle Pattern vs Rising Wedge: Key Differences
- Trendline Slopes:
- Ascending Triangle: Horizontal resistance, upward-sloping support
- Rising Wedge: Both trendlines slope upward
- Price Direction:
- Ascending Triangle: Usually bullish continuation
- Rising Wedge: Often bearish reversal
- Volume Characteristics:
- Ascending Triangle: Increased volume on breakouts
- Rising Wedge: Decreasing volume within the pattern
- Formation Context:
- Ascending Triangle: Typically forms during uptrends
- Rising Wedge: Can form in both uptrends and downtrends
- Trading Approach:
- Ascending Triangle: Look for bullish breakouts
- Rising Wedge: Anticipate bearish breakdowns
The difference between a rising wedge and ascending triangle is quite clear when you look at the chart. In an ascending triangle, the resistance line is horizontal, while in a rising wedge, the resistance line has a slope. The direction of the two patterns is also different. An ascending triangle has a bullish direction, while a rising wedge has a bearish direction. The shape of the two patterns is also different. An ascending triangle has a flat top and a curved bottom, while a rising wedge has a sloping top and bottom. To avoid confusion, you need to watch the behaviour of the price once the pattern is completed.
The question of whether a rising wedge is more reversal or trend continuation has been much debated by analysts. Most believe that it serves as a continuation pattern, while others view it as a potential reversal pattern. There are a few key differences between the two that can help to distinguish the two. First, volume is typically higher on downswings for the rising wedge, while it is higher on upswings for the ascending triangle. Second, the rising wedge typically has shallower slopes than the ascending triangle. Finally, the rising wedge typically forms after a period of consolidation, while the ascending triangle often forms after a steep decline. Taken together, these factors suggest that the rising wedge is more likely to be a continuation pattern than a reversal pattern. However, it is important to remember that no pattern is guaranteed to produce a particular outcome and that any given pattern should be considered in the context of the overall market trend.
Already an experienced trader? Get funded now
The Rising Wedge vs Ascending Triangle
The ascending triangle and rising wedge patterns are two of the most commonly used technical analysis tools. Both patterns are similar in that they provide clear entry and exit points for traders. However, there is a key difference between the two patterns that novice traders need to be aware of. The major difference between the two patterns lies in the resistance line. In an ascending triangle, the resistance line is horizontal, while in a rising wedge, the resistance line has a slight slope. This difference can be confusing for novice traders, but it is important to watch the behaviour of price once the pattern is completed in order to avoid confusion. By understanding the key differences between these two patterns, traders can more effectively use them to their advantage.
If you’re a chart analyst, then it’s important to be able to identify different patterns in order to make predictions about future price movements. Two common patterns are the ascending triangle and the rising wedge. Both of these patterns serve the same function of indicating a potential reversal in the current trend. However, the rising wedge is generally considered to be more of a reversal pattern than the ascending triangle. This is because the volume is typically higher on the downswings in a rising wedge, while in an ascending triangle, the volume is typically higher on the upswing move. Therefore, if you want to further enhance your understanding of these patterns, you should focus on the volume.
What is the Best Way to Trade a Rising Wedge?
When trading a rising wedge, the standard way to open a position is to enter the market when the price breaks out above the resistance line. The resistance line is typically the trend line, which has a greater slope. Stop-loss is set either below the level or just below the low of the breakout candle. The target profit is located at the upper border of the pattern. If we consider trading a rising wedge as part of a pullback strategy, then our task is to find the right moment to enter the market.
The most conservative approach would be to wait for the price to break out above the resistance line and then enter the market. However, this could lead to us missing out on some potential profits. A more aggressive approach would be to enter the market as soon as the price starts to retrace back up towards the resistance line. This could give us a better chance of getting in at a lower price, but it does come with an increased risk of being stopped if the price doesn’t continue higher. Ultimately, it’s up to each individual trader to decide which approach they want to take.
Anytime you enter a trade, you are taking on some amount of risk. The key to successful trading is to manage that risk and ensure that the potential rewards of the trade outweigh the risks. One way to do this is to determine the ratio of risk to reward for a trade before entering into it. To do this, you need to estimate the approximate point of take profit. This will give you a target for your profits, and you can then calculate how much you are willing to risk in order to reach that target. By managing your risk in this way, you can increase the chances of success for your trades and overall profitability.
Already an experienced trader? Get funded now
The pros and cons of the rising wedge
Pros
1. Easily identified by more experienced traders, who can spot it in various markets.
2. It has a clear definition of stop, entry, and limit levels.
3. This offers a favourable risk/reward ratio for traders.
Cons
- It’s often difficult to identify for novice traders.
- It can mean both a reversal and continuation of the trend, so additional confirmation is needed.
- Other technical indicators and oscillators should be consulted for confirmation.
How to trade the ascending triangle shape
There are a few different ways to trade an ascending triangle, depending on whether you think the price will break out or pull back. The standard way to open a position is to enter the market when the price breaks the resistance level for the ascending triangle (buy), the support level – for the downtrend (sell short), and the trend line – for the symmetric one (up–buy, down – sell short).
Stop-loss is set immediately behind the level or trend line. Another option is to wait for a breakout above or below the triangle, and then enter the market in that direction. This can be a bit riskier, as you may not get into your position at the optimal price. Finally, you could also wait for a pullback to one of the support or resistance levels before entering the market. This strategy may provide a better entry price, but it also carries more risk if the price doesn’t pull back as expected. Whichever strategy you choose, make sure you have a plan in place before entering any trades.
To open a position conservatively, we wait for the first price pullback after a breakout. We then set the stop loss in a similar fashion and only enter the market afterwards.
Remember to always be aware of your trade volume. When a breakout happens, levels increase significantly and continue this dynamic as the trend goes on. Also, don’t put limit orders too far away from the initial entry point. It’s much better to take the trade from the beginning than later down the line.
Already an experienced trader? Get funded now
The pros and cons of ascending triangle
Pros
- The pros of ascending triangle are that it is easy to spot on the chart, it has a clear target breakout level, and since it is a medium-term pattern, traders can make short-term trades within the pattern while preferring trades in the previous trend direction.
- The con of ascending triangle is that it can often trap traders into a false breakout.
- The ascending triangle can be found in both bullish and bearish markets.
- The length of time for an ascending triangle to form can vary greatly. It is very easy to spot on the chart.
- This pattern has a clear target breakout level.
- Since this is a medium-term pattern, traders can make short-term trades within the pattern while preferring trades in the previous trend direction.
Cons
- Breakouts can be false.
- The price may stay stable for an extended period or start falling.
Mastering the Ascending Triangle Pattern and Rising Wedge
In the world of price action trading, two popular patterns are the rising wedge and ascending triangle. Understanding the differences between them is crucial for forex traders. While both patterns involve converging trendlines, their implications for price movement differ significantly. The ascending triangle pattern often signals a bullish continuation, while the rising wedge frequently indicates a potential bearish reversal.
By mastering these patterns, traders can:
- Improve their ability to predict potential price movements
- Identify optimal entry and exit points
- Manage risk more effectively
- Enhance overall trading strategy
The major difference between the two patterns is that an ascending triangle has a horizontal resistance line, while a rising wedge does not. Both patterns can be traded through a breakout of the pattern or a pullback to the broken zone. These patterns are easy to identify but false breakouts may occur. When trading either of these patterns, it’s important to use caution and to be prepared for a possible false breakout.
Remember, no pattern guarantees a specific outcome. Always use these patterns in conjunction with other technical analysis tools and maintain proper risk management practices in your forex trading.
Already an experienced trader? Get funded now
Applying These Patterns in 2026
Identifying the pattern is only the first step. To pass an evaluation with Funded Trading Plus, you need to execute the trade with precise risk management.
1. Validate the Strategy
Don’t just guess. See how professional traders use breakout patterns like the Ascending Triangle in our curated list of the Top 10 Prop Trading Strategies. This resource includes video breakdowns by Andrew Lockwood on how to time your entries to avoid false breakouts.
2. Manage the Risk
Breakouts can fail. If an Ascending Triangle turns into a “fakeout,” you must have a stop-loss in place. We recommend risking no more than 1-2% per trade to protect your account’s drawdown limit.
3. Learn from the Data
The market is always changing. Stay ahead of the curve by accessing The Best Prop Trading Education in our PropIQ hub, where we use real data to show what separates passing traders from failing ones.
Ready to test your eye for patterns?Apply these technical skills on a Funded Trading Plus Evaluation and see if you can turn these chart patterns into a funded account.
Education Disclaimer
All strategy education provided by Funded Trading Plus, including videos, guides, and written materials, is for educational purposes only. Any strategies or trade examples shown are based on simulated trading environments and are not guarantees of success, profit, or passing an evaluation.
Trading outcomes depend on individual decision-making, discipline, and changing market conditions. The performance of any strategy can vary and may result in simulated losses or program failure.
Nothing in this material should be taken as financial advice or an encouragement to trade or invest real money. Trading and simulated trading both carry risk, and past simulated performance does not guarantee future results.
Before making any trading or financial decisions outside a simulated environment, you should seek independent financial advice.